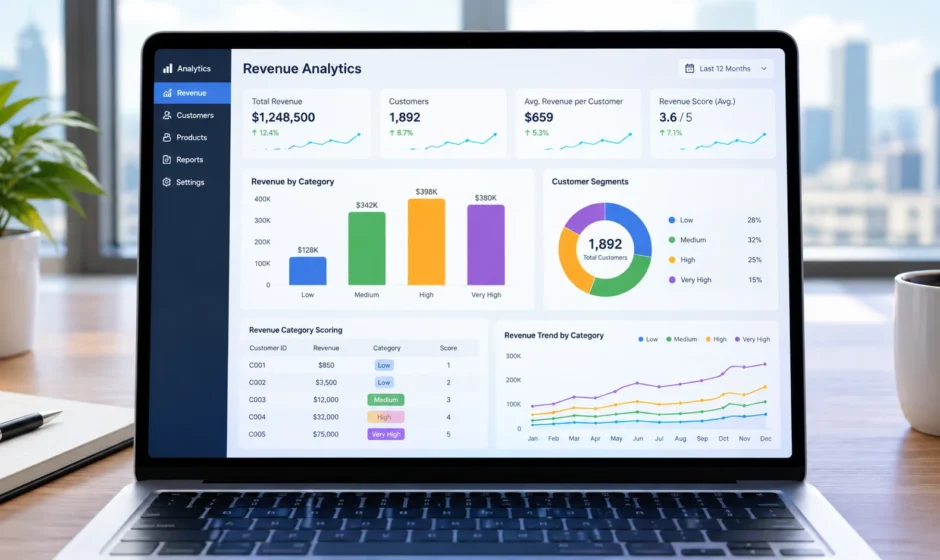

Revenue data can tell you how much a customer, product, account, or business unit generates, but raw revenue figures do not always make prioritization easy. Revenue category scoring converts revenue values into defined categories and assigns scores to those categories, making revenue easier to compare, segment, visualize, and use in business analytics.
A practical revenue scoring model follows a simple process:
Define the objective → collect revenue data → choose the measurement period → create revenue categories → assign scores → validate the model → implement the score → monitor and update it.
This guide explains how to build a revenue category scoring model, choose appropriate thresholds, calculate scores, and implement the model in Excel, SQL, and Power BI. The numerical thresholds used in examples are illustrative and should be adapted to the business, industry, revenue distribution, and measurement period.
How to Implement Revenue Category Scoring?
To implement scoring by revenue category in business analytics:
- Define the objective of the scoring model.
- Collect reliable revenue data for customers, products, accounts, or business units.
- Choose a measurement period, such as monthly, quarterly, annual, MRR, ARR, or trailing 12-month revenue.
- Create revenue categories using fixed thresholds, percentiles, quartiles, or another appropriate method.
- Assign numerical scores to each revenue category.
- Validate the scoring model against the actual distribution of your revenue data.
- Implement the score in Excel, SQL, Power BI, or your analytics platform.
- Monitor and update the model when revenue patterns or business priorities change.
The important point is that there is no universal revenue threshold that works for every business. The scoring method should match the purpose of the analysis and the distribution of the underlying data.
What Is Revenue Category Scoring?
Revenue category scoring is a method of grouping revenue values into defined ranges and assigning a numerical score to each range.
For example, a business could create illustrative categories such as:
| Revenue Category | Example Revenue Range | Example Score |
|---|---|---|
| Very Low | $0–$999 | 1 |
| Low | $1,000–$4,999 | 2 |
| Medium | $5,000–$19,999 | 3 |
| High | $20,000–$49,999 | 4 |
| Very High | $50,000+ | 5 |
These thresholds are illustrative rather than industry benchmarks. A business should select thresholds based on its own revenue distribution, objectives, customer base, and reporting period.
The basic idea is:
Revenue value → Revenue category → Numerical score
For example, if a customer generates $25,000 during the selected measurement period, the customer could fall into the High category and receive a score of 4 under the illustrative model above.
Why Revenue Category Scoring Matters
Raw revenue numbers can become difficult to interpret when an organization has hundreds or thousands of customers, products, or accounts. A scoring model can simplify that information into consistent categories.
Prioritize Analysis
Scores make it easier to identify high-value and low-value segments without comparing every individual revenue figure.
Improve Segmentation
Revenue scores can support customer, product, account, or business-unit segmentation.
Simplify Reporting
Dashboards can display categories such as Low, Medium, High, and Very High instead of relying entirely on raw revenue values.
Support Resource Allocation
Revenue score can be one input when deciding where additional sales, marketing, service, or account-management attention may be appropriate.
A high revenue score should not automatically determine a business decision. Other factors, such as profitability, growth, churn risk, strategic importance, and customer potential, may also matter.
Track Changes Over Time
A consistent scoring framework can make it easier to monitor movement between revenue categories over time.
How Revenue Categories Work
A revenue category is a defined range or group into which a revenue value falls.
There are several ways to create these categories.
Fixed Thresholds
Fixed thresholds use predefined revenue ranges.
For example:
- $0–$999 = Very Low
- $1,000–$4,999 = Low
- $5,000–$19,999 = Medium
- $20,000–$49,999 = High
- $50,000+ = Very High
This approach is easy to explain and works well when business thresholds are stable and meaningful.
Percentile-Based Categories
Percentile scoring divides observations according to their position within the revenue distribution.
For example, a company might classify:
- Bottom 20% = Very Low
- 20th–40th percentile = Low
- 40th–60th percentile = Medium
- 60th–80th percentile = High
- Top 20% = Very High
This method is useful when revenue is unevenly distributed and fixed thresholds would create unbalanced groups.
Quartile-Based Categories
Quartiles divide the data into four groups based on the distribution.
- Q1 = Lower revenue group
- Q2 = Lower-middle revenue group
- Q3 = Upper-middle revenue group
- Q4 = Highest revenue group
Quartile scoring can be useful when the goal is relative segmentation rather than predefined business thresholds.
Historical Categories
A business can also use historical revenue patterns to define meaningful categories. For example, thresholds could be based on previous annual revenue distributions.
The important consideration is consistency. If thresholds change frequently without a clear reason, comparing scores over time becomes more difficult.
How to Build a Revenue Scoring Model
Step 1: Define the Objective
Start by determining why you need revenue scoring.
Possible objectives include:
- Customer segmentation
- Sales prioritization
- Revenue reporting
- Account analysis
- Product segmentation
- Dashboard reporting
- Business-unit comparison
The objective affects the scoring method you choose.
Step 2: Collect Revenue Data
Use a reliable source for the revenue values.
A basic dataset could contain:
| Customer ID | Revenue | Period | Category | Score |
|---|---|---|---|---|
| C001 | $850 | Annual | Very Low | 1 |
| C002 | $3,500 | Annual | Low | 2 |
| C003 | $12,000 | Annual | Medium | 3 |
| C004 | $32,000 | Annual | High | 4 |
| C005 | $75,000 | Annual | Very High | 5 |
The revenue period must be clearly defined. Monthly revenue should not be mixed with annual revenue without an appropriate transformation.
Step 3: Choose the Measurement Period
The measurement period is an important part of the scoring model.
Depending on the business, you might use:
- Monthly revenue
- Quarterly revenue
- Annual revenue
- Trailing 12-month revenue
- Monthly recurring revenue (MRR)
- Annual recurring revenue (ARR)
For example, an SaaS business may use ARR when comparing recurring customer value, while an e-commerce business may use annual or trailing 12-month sales.
The selected period should match the business question.
Step 4: Create Revenue Categories
Select a categorization method.
You can use:
- Fixed thresholds
- Percentiles
- Quartiles
- Rank-based categories
- Weighted scoring
The categories should be mutually understandable and consistently applied.
Step 5: Assign Scores
Assign a numerical value to each category.
| Category | Score |
|---|---|
| Very Low | 1 |
| Low | 2 |
| Medium | 3 |
| High | 4 |
| Very High | 5 |
The score should have a clear interpretation. A score of 5 should represent the highest revenue category under the selected scoring framework.
Step 6: Validate the Model
Before using the score in business decisions, test how the model behaves against real data.
Check:
- How many records fall into each category?
- Are most customers concentrated in one category?
- Are the thresholds too narrow or too broad?
- Are extreme values distorting the model?
- Does the score support the original business objective?
If 90% of customers fall into one category, the model may not provide enough useful segmentation.
Step 7: Implement the Score
Once validated, implement the model in the system used by the analytics team.
Common tools include:
- Excel
- SQL
- Power BI
- Business intelligence platforms
- Customer analytics systems
Step 8: Monitor and Update
Revenue patterns can change. Review the scoring model periodically and update thresholds when there is a meaningful business reason.
Document any threshold changes so users understand why historical scores may differ.
Revenue Scoring Methods Compared
Different scoring approaches solve different problems.
| Method | How It Works | Useful When |
|---|---|---|
| Fixed Thresholds | Uses predefined revenue ranges | Business thresholds are known |
| Percentile | Scores based on distribution position | Revenue is highly uneven |
| Quartile | Divides observations into four groups | Relative segmentation is needed |
| Rank-Based | Scores based on position | Direct ordering is important |
| Weighted | Combines revenue with other factors | Revenue alone is not sufficient |
There is no single scoring method that is correct for every business.
Fixed Threshold Revenue Scoring
Fixed thresholds are one of the easiest models to implement.
| Revenue | Category | Score |
|---|---|---|
| $850 | Very Low | 1 |
| $3,500 | Low | 2 |
| $12,000 | Medium | 3 |
| $32,000 | High | 4 |
| $75,000 | Very High | 5 |
The main advantage is interpretability. Stakeholders can immediately understand what each category represents.
The limitation is that fixed thresholds may become less useful when the underlying revenue distribution changes significantly.
Percentile Revenue Scoring
Percentile scoring evaluates revenue relative to other records.
For example, instead of saying that $50,000 is always a Very High revenue value, the model asks where $50,000 sits within the current revenue distribution.
This can be useful when the business has a large difference between its smallest and largest customers.
Percentile-based scoring is particularly useful when you want balanced groups rather than fixed business thresholds.
Quartile Revenue Scoring
Quartile scoring divides revenue observations into four sections.
The lowest quarter belongs to Q1 and the highest quarter belongs to Q4.
This provides a relative view of revenue performance and can be useful for segmentation and dashboard analysis.
One limitation is that a quartile does not necessarily correspond to a meaningful business value. Q4 means the highest quarter within the dataset, not necessarily that those customers meet a specific strategic revenue threshold.
Rank-Based Revenue Scoring
Rank-based scoring orders records from highest to lowest revenue.
| Customer | Revenue | Rank |
|---|---|---|
| C005 | $75,000 | 1 |
| C004 | $32,000 | 2 |
| C003 | $12,000 | 3 |
| C002 | $3,500 | 4 |
| C001 | $850 | 5 |
Rank is useful when the primary objective is ordering.
However, rank does not tell you how large the revenue difference is between two records.
A customer ranked #1 could generate $75,000 while the customer ranked #2 generates $32,000. The ranks are consecutive even though the revenue difference is substantial.
Weighted Revenue Scoring
Revenue can also be combined with other business variables.
For example:
Revenue Score = Revenue Category Weight × Business Priority Factor
If a customer has a revenue category weight of 4 and a business priority factor of 1.2:
Revenue Score = 4 × 1.2 = 4.8
The business priority factor could represent another approved business criterion.
However, the factor should be clearly defined and consistently applied. A weighted score should not be introduced simply to make a model appear more sophisticated.
Revenue Scoring Formula
A simple category-based model can assign scores directly:
- Very Low = 1
- Low = 2
- Medium = 3
- High = 4
- Very High = 5
For businesses that need a continuous score rather than categories, a normalized revenue score can also be used:
Normalized Revenue Score = ((Revenue − Minimum Revenue) / (Maximum Revenue − Minimum Revenue)) × 100
For example, if:
- Minimum revenue = $1,000
- Maximum revenue = $101,000
- Customer revenue = $51,000
Then:
Normalized Score = ((51,000 − 1,000) / (101,000 − 1,000)) × 100
Normalized Score = 50
This is different from category scoring. A category score simplifies revenue into discrete groups, while a normalized score preserves more information about the relative position of the revenue value.
Complete Revenue Scoring Example
Consider a SaaS company with four customers.
| Customer | Annual Revenue | Revenue Category | Revenue Score |
|---|---|---|---|
| A | $2,000 | Low | 2 |
| B | $8,000 | Medium | 3 |
| C | $25,000 | High | 4 |
| D | $60,000 | Very High | 5 |
Under this illustrative model, Customer D has the highest revenue score.
However, revenue score alone does not necessarily mean Customer D should automatically receive the highest business priority.
The company could also consider:
- Revenue growth
- Profitability
- Churn risk
- Customer lifetime value
- Strategic importance
- Expansion potential
- Service requirements
This illustrates why revenue scoring is often most useful as one component of a broader business analytics model.
How to Choose Revenue Thresholds
Choosing thresholds is one of the most important parts of revenue category scoring.
Use Fixed Thresholds When
Use fixed thresholds when:
- Business stakeholders already understand the revenue ranges.
- The ranges have a clear business meaning.
- You need stable reporting categories.
- You want simple explanations.
Use Percentiles When
Use percentiles when:
- Revenue is highly uneven.
- You need relative segmentation.
- Fixed thresholds produce highly unbalanced groups.
Use Quartiles When
Use quartiles when:
- You want four relative groups.
- The exact monetary thresholds are less important.
- You want a simple distribution-based model.
Use Weighted Scoring When
Use weighted scoring when:
- Revenue alone is insufficient.
- Multiple business variables need to be considered.
- Each variable has a defined business purpose.
Revenue Scoring in Excel
Excel can implement a simple category model using IFS.
For example:
=IFS(
B2<1000,"Very Low",
B2<5000,"Low",
B2<20000,"Medium",
B2<50000,"High",
B2>=50000,"Very High"
)
If the revenue is stored in cell B2, this formula assigns a category based on the illustrative thresholds.
A corresponding score can be created with:
=IFS(
B2<1000,1,
B2<5000,2,
B2<20000,3,
B2<50000,4,
B2>=50000,5
)
For production reporting, it is often better to store thresholds in a separate lookup table so they can be changed without rewriting formulas.
Revenue Scoring With SQL
SQL can use CASE statements to create revenue categories.
SELECT
    customer_id,
    revenue,
    CASE
        WHEN revenue < 1000 THEN 'Very Low'
        WHEN revenue < 5000 THEN 'Low'
        WHEN revenue < 20000 THEN 'Medium'
        WHEN revenue < 50000 THEN 'High'
        ELSE 'Very High'
    END AS revenue_category
FROM customers;
A score can be added with another CASE statement:
SELECT
    customer_id,
    revenue,
    CASE
        WHEN revenue < 1000 THEN 'Very Low'
        WHEN revenue < 5000 THEN 'Low'
        WHEN revenue < 20000 THEN 'Medium'
        WHEN revenue < 50000 THEN 'High'
        ELSE 'Very High'
    END AS revenue_category,

    CASE
        WHEN revenue < 1000 THEN 1
        WHEN revenue < 5000 THEN 2
        WHEN revenue < 20000 THEN 3
        WHEN revenue < 50000 THEN 4
        ELSE 5
    END AS revenue_score

FROM customers;
For larger analytics systems, storing threshold definitions separately can make the model easier to maintain.
Revenue Scoring in Power BI
Power BI can use calculated columns or measures to classify revenue.
A simple DAX calculated column could use SWITCH(TRUE()):
Revenue Category =
SWITCH(
    TRUE(),
    [Annual Revenue] < 1000, "Very Low",
    [Annual Revenue] < 5000, "Low",
    [Annual Revenue] < 20000, "Medium",
    [Annual Revenue] < 50000, "High",
    "Very High"
)
A corresponding score can be created as:
Revenue Score =
SWITCH(
    TRUE(),
    [Annual Revenue] < 1000, 1,
    [Annual Revenue] < 5000, 2,
    [Annual Revenue] < 20000, 3,
    [Annual Revenue] < 50000, 4,
    5
)
Power BI can then use the score and category in dashboards, filters, charts, and segmentation analysis.
For maintainability, organizations may prefer a dedicated threshold table instead of hard-coding business rules directly into DAX.
Revenue Scoring by Business Type
The appropriate scoring approach can differ by business model.
SaaS
SaaS companies may analyze:
- ARR
- MRR
- Customer revenue
- Expansion revenue
- Revenue growth
Revenue scoring can help segment accounts, but SaaS organizations may also need churn and retention metrics.
E-Commerce
E-commerce businesses may use:
- Annual customer revenue
- Average order value
- Purchase frequency
- Customer lifetime value
Revenue category scoring can help identify different customer-value groups.
B2B
B2B businesses may score accounts based on:
- Annual contract value
- Account revenue
- Revenue potential
- Existing revenue
- Expansion opportunity
Retail
Retail businesses may analyze revenue by:
- Store
- Product
- Customer
- Region
- Product category
The scoring model should match the level of analysis.
Revenue Score vs Revenue Rank vs Revenue Category
These concepts are related but not identical.
| Metric | Meaning | Example |
|---|---|---|
| Revenue | Actual monetary value | $25,000 |
| Revenue Category | Group containing the revenue value | High |
| Revenue Score | Numerical value assigned to the category | 4 |
| Revenue Rank | Position compared with other records | #2 |
For example, two customers can have the same revenue category and score while having different exact revenue values.
A rank is different because it describes position within the dataset rather than membership in a predefined category.
Revenue Score vs Profitability and Other Metrics
Revenue is important, but it does not represent every aspect of business performance.
A customer can generate high revenue while producing relatively low profit.
For that reason, organizations may combine revenue analysis with:
- Profit margin
- Customer lifetime value
- Revenue growth
- Churn risk
- Customer acquisition cost
- Retention
- Strategic value
The correct combination depends on the business objective.
Common Revenue Scoring Mistakes
Using Arbitrary Thresholds
Thresholds should have a reason behind them. Avoid selecting ranges simply because they look convenient.
Mixing Measurement Periods
Do not compare monthly revenue for one customer with annual revenue for another without clearly transforming or labeling the data.
Ignoring Revenue Distribution
A fixed threshold model can become ineffective if most records fall into one category.
Overcomplicating the Model
Adding too many variables can make the scoring system difficult to explain and maintain.
Treating the Score as the Final Business Decision
A revenue score is an analytical input, not necessarily a complete decision model.
Failing to Review the Model
Revenue patterns can change. A scoring system should be reviewed when business conditions or data distributions change.
Benefits and Limitations of Revenue Scoring
Benefits
Revenue category scoring can:
- Simplify large datasets
- Improve segmentation
- Make dashboards easier to interpret
- Support prioritization
- Standardize revenue classification
- Help compare customer or product groups
Limitations
Revenue scoring can:
- Hide differences within the same category
- Depend heavily on threshold selection
- Become outdated when revenue patterns change
- Ignore profitability
- Ignore growth or churn
- Oversimplify complex business decisions
These limitations are why revenue scoring should generally be used alongside other relevant metrics when making important business decisions.
How to Improve a Revenue Scoring Model
A revenue scoring model can become more useful when it is regularly tested and documented.
Consider these improvements:
- Review category distribution to determine whether categories are balanced.
- Document thresholds so stakeholders understand the scoring logic.
- Track changes over time rather than looking only at a single period.
- Separate revenue scoring from business priority when other factors influence decisions.
- Use automated calculations in SQL, Power BI, or other analytics systems.
- Review thresholds periodically when the revenue distribution changes.
- Combine revenue with relevant metrics when revenue alone does not answer the business question.
Frequently Asked Questions
What is revenue category scoring?
Revenue category scoring groups revenue values into predefined categories and assigns a numerical score to each category.
How do you score customers based on revenue?
First, choose a measurement period and define revenue categories. Then assign numerical scores to the categories and apply the rules consistently to each customer.
What is a good revenue scoring model?
A useful model is one that matches the business objective, uses reliable revenue data, has understandable thresholds, and produces meaningful segmentation. There is no universal scoring model that fits every organization.
Should revenue scoring use fixed thresholds or percentiles?
Fixed thresholds are useful when specific revenue ranges have business meaning. Percentiles can be useful when the goal is relative segmentation based on the distribution of revenue.
Can revenue scoring be done in Excel?
Yes. Excel functions such as IFS, lookup functions, and formulas can classify revenue and assign scores.
Can SQL be used for revenue scoring?
Yes. SQL CASE statements can assign categories and numerical scores based on revenue thresholds.
Can Power BI calculate revenue scores?
Yes. Power BI can use DAX calculated columns or measures to classify revenue and assign scores.
Should revenue score be based only on revenue?
Not always. If the business decision also depends on profitability, growth, churn, customer lifetime value, or strategic importance, those metrics may need to be included in a broader model.